Implementation Guide: How to Measure Product-Market Fit (PMF)
- Chris Hug
- Nov 5, 2025
- 10 min read
Updated: Dec 14, 2025
You don't need perfect data to start measuring PMF. You need directional clarity.
Most companies wait for revenue to decline before diagnosing product-market fit. By then, the problem started six months ago, and you've already burned budget on the wrong fixes.
This is the third of three related posts in our Complete Guide to Measuring Product-Market Fit.
In Part 1, you learned the 5 stages of PMF strength. In Part 2, you saw the 5 dimensions where fit weakens. Here, you'll get the practical steps: how to assess where you are, what to track, and easy ways to catch drift before it costs you.
At-a-glance
The implementation path:
Start: Take the PMF Health Check (10 min, get your score + weak dimensions)
Then: Follow the 5-step process based on your score
Track: 15-minute monthly check-in + quarterly review
Watch for: Red flags that signal drift
What you'll get:
Self-assessment tools
Stage-specific guidance (what to measure at Stage 0 vs Stage 3)
Quick wins checklist
Monthly tracking template
Red flags to watch for
This series:
Part 1 How to Measure Product-Market Fit: Getting Started: The 5 stages of PMF strength
Part 2 Diagnosing PMF: The 5 dimensions where fit is determined
5-steps to implement measuring product-market fit.
Start: Take the PMF health check
Before diving into implementation, find out where you actually stand.
The PMF Health Check is a 10-minute diagnostic that asks 10 multiple-choice questions about your company. No fluff. No judgment. Just patterns.
You'll get a high-level and playful:
Your PMF score (0-50 scale)
Dimension breakdown (which of the 5 dimensions are weak)
Top 3 priorities (specific actions based on your answers)
Red flags (concerning patterns we spotted)
How it works: The questions rotate randomly, so you're not gaming the system. They're designed to reveal gaps between what you think is true and what's actually happening. Sales, product, and marketing often have different answers to the same question. That disagreement is data.
Takes 10 minutes. Zero commitment.
Once you have your score, come back here to implement.
Understanding your score: What it means
Your Health Check score maps directly to the 5 PMF stages:
0-10 points: Stage 0 (None - Searching)
You're still validating whether the problem is urgent enough and whether people will pay to solve it. Your focus: problem validation. Talk to 20-30 potential customers. Get 5+ to commit as design partners. See Stage 0 guidance below.
10-20 points: Stage 1 (Low PMF - Early Traction)
You have 5-15 customers, but each one feels hard-won. Your focus: satisfaction. Build something customers genuinely need and can't live without. See Stage 1 guidance below.
20-30 points: Stage 2 (Developing PMF - Patterns Emerging)
You have 10-30 customers, and repeatability is emerging. Your focus: demand. Find 1-2 scalable channels and tighten your ICP. See Stage 2 guidance below.
30-40 points: Stage 3 (Strong PMF - Floodgates Opening)
You have 50-150+ customers. Demand is strong, satisfaction is high. Your focus: efficiency. Drive efficiency without sacrificing experience. See Stage 3 guidance below.
40-50 points: Stage 4 (Saturating PMF - Market Penetration)
You have 250+ customers. You're the default choice in your category. Your focus: expanding TAM. Find PMF again in new markets or segments. See Stage 4 guidance below.
From score to dimension diagnosis
Example: You scored 24/50 (Stage 2: Developing PMF)
Your dimension breakdown might show:
Customer: 7.5/10 🟡 Moderate
Offering: 7.0/10 🟡 Moderate
Story: 4.8/10 🔴 Weak ← Primary issue
Channel: 6.5/10 🟡 Moderate
Company: 7.2/10 🟡 Moderate
What this means:
Your product works (Offering 7.0/10)
You're targeting reasonable customers (Customer 7.5/10)
You can't communicate value clearly (Story 4.8/10 ← weakest)
Team ownership: Marketing + Sales need to fix positioning and messaging
If you work with us, we provide:
Full signal analysis (8 categories scored and tracked)
Weighted dimension scores (formulas calibrated for your stage and segment)
Dimension-by-dimension breakdown (signal contributions, root causes, recommended actions)
3-6 prioritised recommendations with impact, effort, and expected PMF lift
Implementation tasks with team ownership and tools that close the gap
The Health Check gives you directional clarity. Expert diagnosis gives you the full picture with actionable recommendations.
⚠️ Watch for decline: Any stage can enter decline if signals weaken. Monitor monthly for drift.
The 10 questions you answered aren't arbitrary. They map to the eight signal categories that our PMF System tracks:
Questions 1-2 → Persona Fit + Adoption signals (Customer dimension)
Questions 3-4 → Adoption + Retention signals (Offering dimension)
Questions 5-6 → Demand + Value & Proof signals (Story dimension)
Questions 7-8 → Demand + Market Attractiveness signals (Channel dimension)
Questions 9-10 → Risk Severity + Retention signals (Company dimension)
Your score (0-50) maps to PMF stages. Your dimension breakdown shows where fit is weakest.
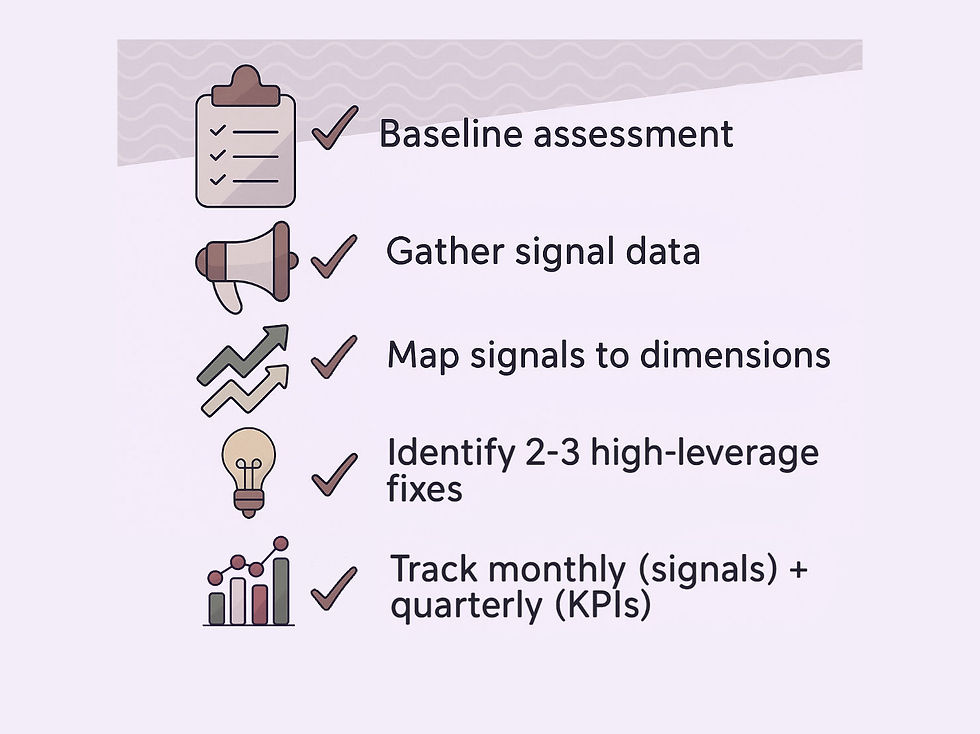
The 5-step implementation process
Step 1: Baseline assessment (cross-team assessment)
Gather your cross-functional team (product, sales, marketing, customer success). Rate each of the five dimensions on a 0-100 scale:
Customer fit: 0 (wrong segment) to 100 (perfect ICP alignment)
Offering fit: 0 (doesn't solve problem) to 100 (solves urgent problem better than alternatives)
Story fit: 0 (can't communicate value) to 100 (differentiation clear and compelling)
Channel fit: 0 (can't reach buyers) to 100 (efficient customer acquisition)
Company fit: 0 (can't execute) to 100 (team delivers at required pace and quality)
Why this works: Teams rate dimensions differently. That's the point. Disagreement reveals perception gaps, which is a PMF signal.
Example: Sales rates Story fit at 40 ("messaging doesn't close deals"). Marketing rates it at 75 ("positioning is clear"). Product rates Offering fit at 85 ("we solve the problem"). Customer success rates it at 50 ("customers struggle to see value").
That disagreement is data. It shows where alignment is missing.
Step 2: Gather signal data you already have
You're already collecting most PMF signals. You're just not organising them.
Pull 3-6 months of data from:
CRM (Salesforce, HubSpot, Pipedrive):
Win rates, sales cycle length, pipeline velocity → Demand Signals
Deal size trends → Value & Proof Signals
Product Analytics (Amplitude, Mixpanel, Heap):
Activation rates, usage frequency → Adoption Signals
Feature adoption, retention cohorts → Retention Signals
Finance Systems (QuickBooks, Stripe, ChartMogul):
Renewal rates, expansion revenue → Retention Signals
Churn timing → Retention Signals
Sales Call Notes:
Win/loss reasons → Competitive Pressure
Objection patterns → Story dimension clues
Customer Conversations:
Who's buying, use case patterns → Persona Fit Signals
Don't wait for perfect analytics. Directional accuracy is enough to start. Estimates work.
Step 3: Map signals to dimensions
Which signals are weakening? Where do they point?
Offering Dimension (Product + Engineering own it):
Primary signals: Retention (40%), Adoption (30%), Value & Proof (30%)
Pattern: Adoption weak + Retention declining → Offering dimension issue
Customer Dimension (Product + Sales own it):
Primary signals: Persona Fit (60%), Adoption (20%), Retention (20%)
Pattern: Persona drifting + Wrong customers churning → Customer dimension issue
Story Dimension (Marketing + Sales own it):
Primary signals: Demand (50%), Value & Proof (30%), Competitive Pressure (20%)
Pattern: Demand weak + Conversion low despite demos → Story dimension issue
Channel Dimension (Sales + Marketing + Partnerships own it):
Primary signals: Demand (50%), Market Attractiveness (40%), Competitive Pressure (10%)
Pattern: Awareness low + Pipeline velocity declining → Channel dimension issue
Company Dimension (CEO + Leadership own it):
Primary signals: Risk Severity inverted (50%), Retention (30%), Market (20%)
Pattern: Execution lagging + Customer experience declining → Company dimension issue
Reality check: Signals often point to multiple dimensions. The weighted formulas identify which dimension has the highest leverage. That's where to focus first.
If you want expert diagnosis: We handle the signal tracking, formula calculations, and pattern recognition. You get dimension scores, prioritised recommendations, and clear team ownership.
Step 4: Identify high-leverage fixes
Based on signal patterns, what are the 2-3 highest-impact actions?
Don't try to fix everything at once. Focus on the dimension showing the greatest weakness or the most leverage for your stage.
Example: Persona Fit Signals show drift (closing SMB when ICP is mid-market). Retention Signals confirm it (SMB customers churn faster). The fix: Customer dimension—refine ICP, update targeting, align sales compensation. Ignore other dimensions for now. Improving Customer fit will have cascading positive effects.
Step 5: Track signals monthly, KPIs quarterly
PMF measurement isn't a one-time project. It's an ongoing discipline.
Monthly signal review (15 minutes):
Update signal data (estimates work)
Identify trends (improving, stable, declining?)
Map changes to dimensions
Make small adjustments
Quarterly KPI review:
Validate signal improvements translated to KPI improvements
Assess overall business health
Make strategic decisions (hiring, budget, roadmap)
Expected timelines:
First clarity: 2-4 cross-team sessions
Signal improvement: 6-12 weeks if addressing the right dimension
KPI improvements: 3-6 months after signal improvements
The 15-minute monthly PMF check-in
Here's a simple ritual. Do this on the first Monday of every month.
Prep (5 min):
Pull last 30 days: win rates, activation rate, churn, pipeline adds
Compared to the prior month and the 3-month average
Review (10 min):
Question 1: Which signals improved? Which declined?
Adoption (activation rate, time to value)
Retention (churn rate, NRR)
Demand (win rate, sales cycle, pipeline velocity)
Value & Proof (expansion revenue, referrals)
Persona Fit (who's buying vs. who should be buying)
Question 2: Do declining signals point to a dimension?
If Adoption declining → Offering or Company dimension
If Demand declining → Story or Channel dimension
If Retention declining → Offering or Customer dimension
Question 3: What's the smallest fix we can test this month?
Not a roadmap overhaul. A small adjustment.
Example: Refine ICP definition → Update lead scoring
Example: Simplify onboarding → Reduce steps from 8 to 5
Track it: Keep a simple log. Month, signals, dimension diagnosis, action taken, result next month.
Quick Wins: 5 things you can do this week
Don't wait for the perfect system. Start with these:
1. Run the ICP Alignment Test
Ask product, sales, and marketing independently: "Who's our ideal customer?" Compare answers. If they don't match, that's your first fix. Schedule 90 minutes to align.
2. Pull Your Last 10 Losses
Why didn't they buy? Look for patterns. Losing to competitors on features? Offering dimension. Losing to "decided to wait"? Story dimension (urgency not established).
3. Check Your Messaging Consistency
Put your website, sales deck, and product docs side by side. Do they tell the same story? If not, that's a Story dimension issue. Pick one version and align everything to it.
4. Calculate Your Time-to-Value
How long does it take a new customer to see their first meaningful outcome? If you don't know, ask 5 recent customers. If it's over 4 weeks, that's an Offering or Company dimension issue.
5. Spot Your Persona Drift
List your last 10 customers. How many match your stated ICP? If fewer than 7, you're drifting. That's a Customer dimension problem.
Red Flags: When PMF is weakening
Watch for these patterns. They signal drift 3-6 months before revenue shows it.
🚩 The Effort-to-Result Gap
Same revenue this quarter as last quarter, but it took 50% more effort. You're working harder for the same results. Signal: Demand weakening, likely Story or Channel dimension.
🚩 The Onboarding Time Creep
Time to first value used to be 2 weeks. Now it's 6 weeks. Customers are taking longer to see value. Signal: Adoption weakening, likely Offering or Company dimension.
🚩 The Churn Surprise
Customers you thought were happy just don't renew. No warning. Signal: Retention signals invisible, likely Company dimension (not tracking health) or Offering dimension (not delivering sustained value).
🚩 The Discount Spiral
You're discounting more to close deals. Average deal size declining. Signal: Value perception weak, likely Story dimension (not communicating value) or Customer dimension (wrong ICP).
🚩 The Feature Request Chaos
Every customer wants completely different features. No patterns. Signal: Customer dimension issue—you're serving too broad a segment or wrong segment entirely.
🚩 The Sales Cycle Stretch
Average sales cycle was 30 days. Now it's 60 days. Deals are taking longer to close. Signal: Demand weakening, likely Story dimension (urgency not established) or Competitive Pressure rising.
🚩 The Renewal Negotiation Grind
Renewals used to be smooth. Now every renewal is a negotiation on price and scope. Signal: Retention weakening, customers questioning value. Likely Offering dimension (not delivering outcomes) or Story dimension (value not clear).
Stage-Specific Guidance: What to measure when
Stage 0 (None - Searching): 0-5 Customers
Primary focus: Validate problem urgency
What to measure:
Can you get 20-30 people to talk about the problem?
Do 60%+ say it's urgent?
Will 5+ become design partners?
What NOT to worry about:
Win rates (too early)
Efficiency metrics (premature)
Scalable channels (not relevant yet)
Action cadence: Weekly customer conversations
Stage 1 (Low PMF): 5-15 Customers, CHF 50K-500K ARR
Primary focus: Satisfaction (Offering dimension)
What to measure:
Weekly usage frequency
Time to first value
Would 40% be "very disappointed" without your product? (Sean Ellis threshold)
Number of users per customer
What NOT to worry about:
Scalable channels (too early)
Competitive differentiation (not enough data)
Action cadence:
Weekly: Talk to customers, observe usage
Monthly: Assess sustained value delivery
Stage 2 (Developing PMF): 10-30 Customers, CHF 500K-2M ARR
Primary focus: Demand (Story + Channel dimensions)
What to measure:
Win rates by channel
Sales cycle length trends
Persona fit patterns (who converts fastest?)
Renewal rates (early signal)
First-call to closed-won conversion
What NOT to worry about:
Burn multiple optimisations (too early)
Advanced automation (maintain human touch)
Action cadence:
Weekly: Pipeline velocity, conversion rates
Monthly: Signal trends, adjust targeting/messaging
Stage 3 (Strong PMF): 50-150+ Customers, CHF 2M-15M ARR
Primary focus: Efficiency (Company dimension)
What to measure:
CAC and CAC payback period
Gross margin trends
NRR (net revenue retention)
Onboarding time to value
Support response times
Burn multiple
What NOT to sacrifice:
Customer experience quality for efficiency
Growth rate for profitability (unless strategic shift)
Action cadence:
Weekly: Efficiency metrics
Monthly: All 8 signal categories (drift detection)
Stage 4 (Saturating PMF): 250+ Customers, CHF 15M+ ARR
Primary focus: Expanding TAM
What to measure:
Market penetration in the current segment
New segment opportunity signals
Product expansion adoption
Partner channel effectiveness
Watch for: Growth slowing despite the market still growing (captured most addressable customers in current positioning).
Tools and Resources
For signal tracking:
CRM for win rates, buyer personas, buyer agenda, pipeline velocity
Product analytics for activation, usage, and retention
Finance system for churn, expansion revenue
Simple spreadsheet to log monthly trends
For dimension diagnosis:
Cross-team workshops (quarterly)
Win/loss interview notes
Customer conversation summaries
Don't over-engineer it. A spreadsheet tracking 5-8 signals monthly is better than a complex dashboard you never look at.
When to get expert help
Self-assessment works when:
You have clear data access
Cross-functional team can dedicate time
You're comfortable diagnosing dimensions
Signals show clear patterns
Consider expert help when:
Signals point to multiple dimensions (need prioritisation help)
Team has conflicting theories about the root cause
You've made changes, but signals aren't improving
Revenue is declining, but we can't identify which signals weakened first
Your next step
Start measuring today:
1. Take the PMF Health Check (10 min)
2. Based on your score:
40-50: Focus on preventing drift (Stage 3-4 guidance above)
30-39: Identify weak dimensions (use diagnostic patterns)
20-29: Run baseline assessment (gather your team)
Below 20: Consider expert diagnosis
3. Set up your monthly 15-minute check-in
First Monday of every month. Pull signals. Spot trends. Make small adjustments.
Looking for an expert-led diagnosis system?
The Venture Guidebook PMF System combines workshops, AI-powered research, and structured frameworks to diagnose fit across all dimensions, with initial clarity in the first sessions.
We help you diagnose which dimension is weakest, identify specific actions, and build measurement systems to track drift.

